
FENTANYL KILLS MORE 18 to 45 YEARS AMERICANS THAN GUNS DO!
But... they ignore the bigger killer and the moment a gun goes off and kills someone, there’s a Democrat tweeting like mad that guns are bad and that we need more gun control in America. At this point, it doesn’t even matter what kind of gun or why it went off. They’ll use literally any gun shooting to be outraged about the fact that there isn’t enough gun control in the U.S.
Now, if gun control was about saving lives, there should be just as much outrage (or even more) about issues that affect even more Americans.
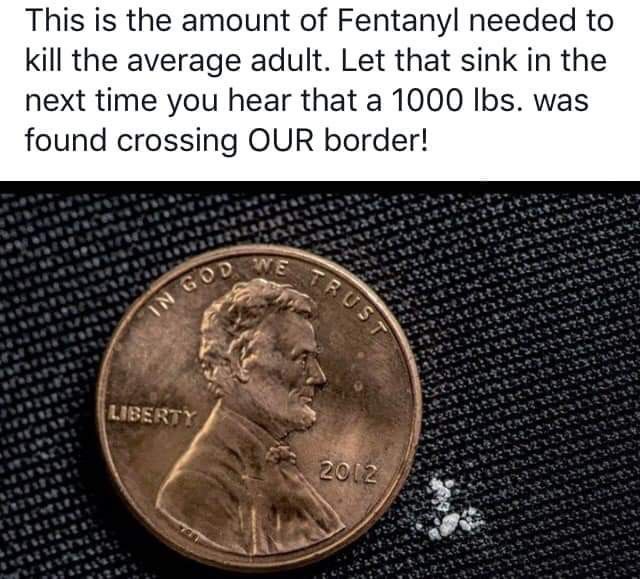
Fentanyl is killing more people than guns. The synthetic opioid has been estimated to be about 100 times stronger than morphine. And, it’s being smuggled across the southern border so that it can be distributed across America.
The more illegal immigration that occurs, the more Fentanyl spills into our states. It’s become a problem – and millions of people are being affected.
Shouldn’t the Democrats be outraged? Well, they should be – that is, if they actually cared about protecting Americans. However, it’s easier to turn a blind eye to the Fentanyl being smuggled in so that they don’t have to admit that the border crisis is the cause of it all. They need the border open to help with their progressive agendas. If it means that it kills thousands of people every year in the process, they’re willing to live with that.
The opioid crisis in America has been relatively hushed in the news. This is because liberal media outlets don’t dare cover it. They would have to report on the hypocrisy of the Democratic Party for allowing it – and, let’s face it, that’s not going to happen.
In D.C., the very town where politicians spend the most time, drugs have killed more of the population than guns. The trend began in 2014, and the overdoses have only been growing. The average age of those overdosing and dying is growing, too.
Much of the overdosing has to do with the desire to seek out pain meds. They don’t have the money to see a doctor, so they’ll buy some on the street. Only, the traditional pain meds are now laced with Fentanyl – and it’s leading to more deaths. And the spike in deaths has been even more considerable during the COVID pandemic.
Lori Post, the Buehler professor of geriatric medicine at Northwestern explained, “We’re taking grandmas and grandpas doing drugs, and to the point of overdosing. We don’t think of them seriously. Not as potential victims of domestic abuse, physical or sexual assault or drug addiction. That needs to change.”
Now that the elderly have been marked as yet another demographic of victims of the opioid crisis, hopefully, more can be done. As Post said, it’s not just the people who have been victims of abuse or assault. Not everyone who is dying of a Fentanyl overdose is a drug addict.
As the Washington Post reported, “Most of the opioid overdose deaths in D.C. last year – 94 percent – involved fentanyl. And most of the users never meant to get near it.”
In D.C., there were over 400 overdose deaths in 2021 – and that’s just one city. If you dig through the news in any city, there are deaths. They’re just not making the front page news because it would be bad for the Democrats who are willing to exchange the deaths of a few hundred Americans for being able to allow thousands of illegal immigrants into the southern border.
Perhaps the next time that a Democrat wants to use a shooting to raise their political agenda, we should just respond with some of the recent opioid statistics. Maybe, then, they’ll get the idea that more Americans are worried about a fentanyl overdose than a gun.
SO How many gun-related deaths in the U.S. last year?
And while we’re at it, how many Fentanyl-related deaths?
We used Pew for the data— an "unbiased" Leftwing source if there is one — it has crunched the numbers, compiled mostly by the “scientists” at the CDC.
In 2021 — according to the CDC — there were 45,222 firearms-related deaths in the U.S.

The 45,222 is a much lower number than I expected … and drilling down further…
============
Suicides – Homicides
According to Pew & the CDC, more than half of the 45,222 gun-related deaths were suicides (24,292) … homicides totaled 19,384 – about 50 each day.

There were 611 law enforcement-related gun deaths in 2021 (they’re lumped into the 3% “other” category).
==============
Mass murders.
The Gun Violence Archive, an online database of gun violence incidents in the U.S., defines mass shootings as incidents in which four or more people are shot, even if no one was killed (excluding the shooters).
Using this broad definition, 513 people died in these incidents in 2020.
Pew’s conclusion: The fatalities in mass shooting incidents in the U.S. account for a very small fraction of all gun murders that occur nationwide each year.
=============
Firearms
According to FBI data analyzed by Pew. Handguns were the instrument of death in the vast majority of gun-related deaths.
“Rifles” – the category that includes guns sometimes referred to as “assault weapons” – were involved in 3% of firearm murders.
Note: Though Pew doesn’t draw a correlation, it’s probably not coincidental that the “rifle” numbers and the “mass murder” numbers are essentially the same.
==============
School Killings
According to James Alan Fox, a criminologist at Northeastern University who has been tracking these events for decades and helps keep the AP/USA Today/Northeastern Mass Killing database:
School massacres like the one in Uvalde are exceptionally rare events. They actually occurred more often in the 1990s than recently.Source
Prof. Fox notes that school shootings are undeniable tragedies, but that “the annual odds that an American child will die in a mass shooting at school are nearly 10 million to 1, about the odds of being killed by lightning or of dying in an earthquake.” Source
=============
Drug Overdose Deaths
For perspective, let’s draw a comparison…
According to WebMD – channeling the CDC:
U.S. deaths attributed to drug overdoses topped 100,000 last year for the first time.
Specifically, in 2021, drug overdose deaths increased 15% to 107,622 … more than double the number of gun-related deaths … and quadruple the number of gun-related homicides.
Fentanyl accounted for 71,238 deaths … almost 3 out of 4 drug overdose deaths
In 2022. with Fentanyl flowing freely across the southern border, it’s widely expected that Fentanyl-related deaths will soar.

Fentanyl is a synthetic opioid that is up to 50 times stronger than heroin and 100 times stronger than morphine. It is a major contributor to fatal and nonfatal overdoses in the U.S.1
There are two types of fentanyl: pharmaceutical fentanyl and the illicitly manufactured fentanyl mostly manufactured in China and shipped to Mexico to be redistributed to the US and European markets.
Both are considered synthetic opioids. Pharmaceutical fentanyl is prescribed by doctors to treat severe pain, especially after surgery and for advanced-stage cancer.

However, most recent cases of fentanyl-related overdose are linked to illicitly manufactured fentanyl, which is distributed through illegal drug markets for its heroin-like effect. It is often added to other drugs because of its extreme potency, which makes drugs cheaper, more powerful, more addictive, and more dangerous.
This drug is more dangerous than any firearm and has only one purpose to get addicts high and kill them. Yet there is no major hue and cry! No Candle light vigils at the emergency rooms where these overdosed patients die. No LEFTY MEDIA REPORTER ITH THE SOMBER FACE ENACTING THE SIGHING AND BROKEN TONES OF THE TYPE THEY USE AT A SHOOTING. NO DEMANDING THAT CHINA STOP THE MANUFCATURE AND EXPORT OF THIS "ASSAULT DRUG" TO AMERICA TO MURDER OUR PEOPLE!
Illicitly manufactured fentanyl
Illicitly manufactured fentanyl (IMF) is available on the drug market in different forms, including liquid and powder1.
Powdered fentanyl looks just like many other drugs. It is commonly mixed with drugs like heroin, cocaine, and methamphetamine and made into pills that are made to resemble other prescription opioids. Fentanyl-laced drugs are extremely dangerous, and many people may be unaware that their drugs are laced with fentanyl.
In its liquid form, IMF can be found in nasal sprays, eye drops, and dropped onto paper or small candies.

- Apache
- Dance Fever
- Friend
- Goodfellas
- Jackpot
- Murder 8
- Tango & Cash 1
Fentanyl and Overdose
Fentanyl and other synthetic opioids are the most common drugs involved in overdose deaths.1 Even in small doses, it can be deadly. Over 150 people die every day from overdoses related to synthetic opioids like fentanyl.2
Drugs may contain deadly levels of fentanyl, and you wouldn’t be able to see it, taste it, or smell it. It is nearly impossible to tell if drugs have been laced with fentanyl unless you test your drugs with fentanyl test strips.
HERE AT THE STATS
Drug Overdose Death Rates
Drug overdose deaths are up 30% year-over-year.
Key Findings

Jump to a state: AL | AK | AZ | AR | CA | CO | CT | DE | FL | GA | HI | ID | IL | IN | IA | KS | KY | LA | ME | MD | MA | MI | MN | MS | MO | MT | NE | NV | NH | NJ | NM | NY | NC | ND | OH | OK | OR | PA | RI | SC | SD | TN | TX | UT | VT | VA | WA | WV | WI | WY
Recent Drug Overdose Deaths
More than four (4) times as many people died from drug overdose (OD) than from homicide in the first month of 2021.
- 96,779 drug overdose deaths were reported from March 2020 to March 2021.
- OD death totals during this period are 36.1% higher than the previous annual high from December 2018 to December 2019 (71,130 deaths).
- Preliminary reports indicate the number of drug overdose deaths in America increased 29.6% in 2020.
- In January 2021, drug overdose deaths exceeded homicides by 306.7%.
- Motor vehicle accidents and suicides combined killed 84.5% as many as ODs.
Deadliest Drugs
| Drug Used in OD | % of Total Deaths* |
|---|---|
| Opioids | 67.8% |
| Cocaine | 21.2% |
| Psychostimulants | 20.6% |
| Methadone | 4.03% |
*This chart includes attributable deaths for each drug; some deaths involve multiple drug types, and percentage totals will exceed 100%.
Drug Overdose Death Rates
Overdose death counts can be deceptive. Just as drug-related deaths aren’t always recorded as overdoses, some overdoses involve multiple drug types.
- The national OD rate is 21.6 deaths per 100,000 residents.
- Among youth and young adults aged 15 to 24 years, the average annual OD death rate is 12.6 out of every 100,000.
- The OD death rate among this same age group is 41.9% lower than the national average death rate.
- Men are more than twice as likely as women to die from drug overdose.
- Women are dying from drug overdoses at a slightly faster annual rate.
- Among 25- to 34-year-olds, the male OD death rate exceeds women’s by 146.8%.
- Opioids are the deadliest drug type; at least one type of opioid is a factor in 71.76% of ODs.
- Opioids kill more than three (3) times as many people as cocaine.
- OD deaths rank just below diabetes in terms of highest death count.
- Between 2018 and 2019, drug overdose rates fell by 4.6% and for the first time since 2012.

Opioid Overdose Death Rates
The fastest growing drug category among OD deaths is synthetic opioids, and many opioid deaths involve other drugs.
- Opioids kill more than 136 Americans every day.
- The national OD death rate increased 255.74% between 2000 and 2019.
- 21.5% was the sharpest year-over-year increase, from 2015 to 2016.
- That same year, the synthetic opioid OD death rate doubled.
- The rate of OD deaths involving any opioid spiked 27.89% from 2015 to 2016.
- Heroin OD death rates increase at an average annual rate of 55.7%.
- The rate of OD deaths involving synthetic opioids increased at an annual rate of 580% over five years (2012-2017).
| Opioid Subcategories |
|---|
| Natural opioids include morphine and codeine. |
| Semi-synthetic opioids include oxycodone, hydrocodone, hydromorphone, and oxymorphone. |
| Methadone is a synthetic opioid that is usually categorized on its own in official data. |
| Synthetic opioids other than methadone include tramadol and fentanyl. |
| Heroin is an illegally manufactured synthetic opioid made from morphine. |
Overdose Deaths Among Demographics
Rapid release data is unavailable, and demographics likely shifted during the recent pandemic.
- Among males, OD deaths have increased at an annual growth rate of 14.16%.
- Among females, OD deaths have increased at an annual growth rate of 14.96%.
- Among women, American Indian and Alaska Natives are the most likely to die from an OD.
- Among men, Black or African Americans are the most likely to die from an OD.
- Among both genders, Asian or Pacific Islanders are the least likely to die due to OD.
- Men aged 25 to 34 years old are the most likely among all age groups to die from an OD.
- Among men in that age group, the OD death rate is 146.82% higher than women in the same age group.
- Among women, overdose deaths are most common among 45- to 54-year-olds.
- Among that age group, men are still 75.64%.

State Drug Overdose Statistics
There is a wide range of overdose death rates among the states; the highest concentration is located in the Northeast, straddling the Great Lakes and Mid-Atlantic regions.
- Maryland sees the greatest overdose death rate among all deaths, with 4.68% of annual deaths attributed to drug overdose.
- California has the highest number of drug overdose deaths at 6,198.
- West Virginia has more drug overdose deaths per capita than any other state (52.8 out of every 100,000 residents).
- Nebraska sees the lowest rate of overdose deaths at 0.95%, with 8.7 deaths out of every 100,000 residents.
- Wyoming has the lowest number of overdose deaths at 79.
- Oklahoma has seen the largest 3-year decrease at an 8.05% annual decline.
- Delaware has seen the largest 3-year increase at an annual growth rate of 16.0%.
*Rate of OD deaths among all deaths of all types.
- 768 drug overdose deaths per year.
- 1.41% of all deaths are from drug overdose.
- OD deaths increased at a 0.51% annual rate over the last 3 years.
- The death rate is 16.3 deaths out of every 100,000 residents.
- This is 21.26% below the national death rate.
- 1.09% of nationwide OD deaths occur in Alabama.
Alaska
- 132 drug overdose deaths per year.
- 2.96% of all deaths are from drug overdose.
- OD deaths increased at an annual rate of 4.79% over the last 3 years.
- The death rate is 17.8 deaths out of every 100,000 residents.
- This is 14.01% below the national average death rate.
- 0.19%% of nationwide OD deaths occur in Alaska.
Arizona
- 1,907 drug overdose deaths per year.
- 3.22% of all deaths are from drug overdose.
- OD deaths increased at an annual rate of 9.74% over the last 3 years.
- The death rate is 26.8 deaths out of every 100,000 residents.
- This is 29.47% above the national average death rate.
- 2.71%% of nationwide OD deaths occur in Arizona.
Arkansas
- 388 overdose deaths per year.
- 1.20% of all deaths are from drug overdose.
- OD deaths decrease at an annual rate of 0.67% over the last 3 years.
- The death rate is 13.5 deaths out of every 100,000 residents.
- This is 34.78% below the national average death rate.
- 0.55% of nationwide OD deaths occur in Arkansas.
California
- 6,198 drug overdose deaths per year.
- 2.31% of all deaths are from drug overdose.
- OD deaths increased at an annual rate of 10.37% over the last 3 years.
- The death rate is 15.0 deaths out of every 100,000 residents.
- This is 27.54% below the national average death rate.
- 8.81%% of nationwide OD deaths occur in California.
Colorado
- 1,079 overdose deaths per year.
- 2.80% of all deaths are from drug overdose.
- OD deaths increased at an annual rate of 2.85% over the last 3 years.
- The death rate is 18.0 deaths out of every 100,000 residents.
- This is 13.04% below the national average death rate.
- 1.58% of nationwide OD deaths occur in Colorado.
Connecticut
- 1,214 overdose deaths per year.
- 3.89% of all deaths are from drug overdose.
- OD deaths increased at an annual rate of 8.38% over the last 3 years.
- The OD death rate is 34.7 deaths out of every 100,000 residents.
- This is 67.63% above the national average death rate.
- 1.73% of nationwide OD deaths occur in Connecticut.
Delaware
- 435 overdose deaths per year.
- 4.61% of all deaths are from drug overdose.
- OD deaths increased at an annual rate of 16.03% over the last 3 years.
- The OD death rate is 48 deaths out of every 100,000 residents.
- This is 131.88% above the national average death rate.
- 0.62% of nationwide OD deaths occur in Delaware.
Florida
- 5,268 overdose deaths per year.
- 2.56% of all deaths are from drug overdose.
- OD deaths decrease at an annual rate of 0.62% over the last 3 years.
- The death rate is 25.5 deaths out of every 100,000 residents.
- This is 23.19% above the national average death rate.
- 7.49% of nationwide OD deaths occur in Florida.
Georgia
- 1,408 overdose deaths per year.
- 1.65% of all deaths are from drug overdose.
- OD deaths increased at an annual rate of 0.18% over the last 3 years.
- The OD death rate is 13.1 deaths out of every 100,000 residents.
- This is 36.71% below the national average death rate.
- 2.00% of nationwide OD deaths occur in Georgia.
Hawaii
- 242 overdose deaths per year.
- 2.12% of all deaths are from drug overdose.
- OD deaths increased at an annual rate of 2.93% over the last 3 years.
- The death rate is 15.9 deaths out of every 100,000 residents.
- This is 23.19% below the national average death rate.
- 0.34% of nationwide OD deaths occur in Hawaii.
Idaho
- 265 overdose deaths per year.
- 1.86% of all deaths are from drug overdose.
- OD deaths increased at an annual rate of 0.57% over the last 3 years.
- The death rate is 15.1 deaths out of every 100,000 residents.
- This is 27.05% below the national average OD death rate.
- 0.38% of nationwide OD deaths occur in Idaho.
Illinois
- 2,790 overdose deaths per year.
- 2.54% of all deaths are from drug overdose.
- OD deaths increased at an annual rate of 6.16% over the last 3 years.
- The death rate is 21.9 deaths out of every 100,000 residents.
- This is 5.80% above the national average OD death rate.
- 3.97% of nationwide OD deaths occur in Illinois.
Indiana
- 1,699 overdose deaths per year.
- 2.59% of all deaths are from drug overdose.
- OD deaths increased at an annual rate of 4.49% over the last 3 years.
- The OD death rate is 26.6 deaths out of every 100,000 residents.
- This is 28.50% above the national average OD death rate.
- 2.42% of nationwide OD deaths occur in Indiana.
Iowa
- 352 overdose deaths per year.
- 1.16% of all deaths are from drug overdose.
- OD deaths increased at an annual rate of 3.93% over the last 3 years.
- The OD death rate is 11.5 deaths out of every 100,000 residents.
- This is 44.44% below the national average OD death rate.
- 0.50% of nationwide OD deaths occur in Iowa.
Kansas
- 403 overdose deaths per year.
- 1.46% of all deaths are from drug overdose.
- OD deaths increased at an annual rate of 8.89% over the last 3 years.
- The OD death rate is 14.3 deaths out of every 100,000 residents.
- This is 30.92% lower than the national average OD death rate.
- 0.57% of nationwide OD deaths occur in Kansas.
Kentucky
- 1,380 overdose deaths per year.
- 2.83% of all deaths are from drug overdose.
- OD deaths decrease at an annual rate of 0.25% over the last 3 years.
- The OD death rate is 32.5 deaths out of every 100,000 residents.
- This is 57.00% above the national average OD death rate.
- 1.96% of nationwide OD deaths occur in Kentucky.
Louisiana
- 1,267 overdose deaths per year.
- 2.75% of all deaths are from drug overdose.
- OD deaths increased at an annual rate of 9.16% over the last 3 years.
- The OD death rate is 28.3 deaths out of every 100,000 residents.
- This is 36.71% above the national average OD death rate.
- 1.80% of nationwide OD deaths occur in Louisiana.
Maine
- 371 overdose deaths per year.
- 2.52% of all deaths are from drug overdose.
- OD deaths increased at an annual rate of 2.73% over the last 3 years.
- The OD death rate is 29.9 deaths out of every 100,000 residents.
- This is 44.44% higher than the national average OD death rate.
- 0.53% of nationwide OD deaths occur in Maine.
Maryland
- 2,369 overdose deaths per year.
- 4.68% of all deaths are from drug overdose.
- OD deaths increased at an annual rate of 4.83% over the last 3 years.
- The OD death rate is 38.2 deaths out of every 100,000 residents.
- This is 84.54% higher than the national average OD death rate.
- 3.37% of nationwide OD deaths occur in Maryland.
Massachusetts
- 2,210 overdose deaths per year.
- 3.74% of all deaths are from drug overdose.
- OD deaths decrease at an annual rate of 0.85% over the last 3 years.
- The OD death rate is 32.1 deaths out of every 100,000 residents.
- This is 55.07% higher than the national average OD death rate.
- 3.14% of nationwide OD deaths occur in Massachusetts.
Michigan
- 2,385 overdose deaths per year.
- 2.41% of all deaths are from drug overdose.
- OD deaths increased at an annual rate of 0.43% over the last 3 years.
- The OD death rate is 24.4 deaths out of every 100,000 residents.
- This is 17.87% higher than the national average OD death rate.
- 3.39% of nationwide OD deaths occur in Michigan.
Minnesota
- 792 overdose deaths per year.
- 1.77% of all deaths are from drug overdose.
- OD deaths increased at an annual rate of 5.46% over the last 3 years.
- The OD death rate is 14.2 deaths out of every 100,000 residents.
- This is 31.40% lower than the national average OD death rate.
- 1.13% of nationwide OD deaths occur in Minnesota.
Mississippi
- 394 overdose deaths per year.
- 1.22% of all deaths are from drug overdose.
- OD deaths increased at an annual rate of 5.07% over the last 3 years.
- The OD death rate is 13.6 deaths out of every 100,000 residents.
- This is 34.30% lower than the national average OD death rate.
- 0.56% of nationwide OD deaths occur in Mississippi.
Missouri
- 1,583 overdose deaths per year.
- 2.51% of all deaths are from drug overdose.
- OD deaths increased at an annual rate of 4.84% over the last 3 years.
- The OD death rate is 26.9 deaths out of every 100,000 residents.
- This is 29.95% higher than the national average OD death rate.
- 2.25% of nationwide OD deaths occur in Missouri.
Montana
- 143 overdose deaths per year.
- 1.43% of all deaths are from drug overdose.
- OD deaths increased at an annual rate of 9.94%.
- The OD death rate is 14.1 deaths out of every 100,000 residents.
- This is 31.88% lower than the national average OD death rate.
- 0.20% of nationwide OD deaths occur in Montana.
Nebraska
- 161 overdose deaths per year.
- 0.95% of all deaths are from drug overdose.
- OD deaths increased at an annual rate of 11.85% over the last 3 years.
- The OD death rate is 8.7 deaths out of every 100,000 residents.
- This is 57.97% lower than the national average OD death rate.
- 0.23% of nationwide OD deaths occur in Nebraska.
Nevada
- 647 overdose deaths per year.
- 2.62% of all deaths are from drug overdose.
- OD deaths decrease at an annual rate of 2.52% over the last 3 years.
- The OD death rate is 20.1 deaths out of every 100,000 residents.
- This is 2.90% lower than the national average OD death rate.
- 0.92% of nationwide OD deaths occur in Nevada.
New Hampshire
- 407 overdose deaths per year.
- 3.19% of all deaths are from drug overdose.
- OD deaths decrease at an annual rate of 6.31% over the last 3 years.
- The OD death rate is 32 deaths out of every 100,000 residents.
- This is 54.59% higher than the national average OD death rate.
- 0.58% of nationwide OD deaths occur in New Hampshire.
New Jersey
- 2,805 overdose deaths per year.
- 3.70% of all deaths are from drug overdose.
- OD deaths increased at an annual rate of 11.81% over the last 3 years.
- The OD death rate is 31.7 deaths out of every 100,000 residents.
- This is 53.14% higher than the national average OD death rate.
- 3.99% of nationwide OD deaths occur in New Jersey.
New Mexico
- 599 overdose deaths per year.
- 3.15% of all deaths are from drug overdose.
- OD deaths increased at an annual rate of 6.39% over the last 3 years.
- The OD death rate is 30.2 deaths out of every 100,000 residents.
- This is 45.89% higher than the national average OD death rate.
- 0.85% of nationwide OD deaths occur in New Mexico.
New York
- 3,617 overdose deaths per year.
- 2.30% of all deaths are from drug overdose.
- OD deaths increased at an annual rate of 0.52% over the last 3 years.
- The OD death rate is 18.2 deaths out of every 100,000 residents.
- This is 12.08% lower than the national average OD death rate.
- 5.14% of nationwide OD deaths occur in New York.
North Carolina
- 2,266 overdose deaths per year.
- 2.41% of all deaths are from drug overdose.
- OD deaths increased at an annual rate of 4.95% over the last 3 years.
- The OD death rate is 22.3 deaths out of every 100,000 residents.
- This is 7.73% lower than the national average OD death rate.
- 3.22% of nationwide OD deaths occur in North Carolina.
North Dakota
- 82 overdose deaths per year.
- 1.27% of all deaths are from drug overdose.
- OD deaths increased at an annual rate of 3.16% over the last 3 years.
- The OD death rate is 11.4 deaths out of every 100,000 residents.
- This is 44.93% lower than the national average OD death rate.
- 0.12% of nationwide OD deaths occur in North Dakota.
Ohio
- 4,251 overdose deaths per year.
- 3.42% of all deaths are from drug overdose.
- OD deaths increased at an annual rate of 0.88% over the last 3 years.
- The OD death rate is 38.3 deaths out of every 100,000 residents.
- This is 85.02% higher than the national average OD death rate.
- 6.05% of nationwide OD deaths occur in Ohio.
Oklahoma
- 645 overdose deaths per year.
- 1.58% of all deaths are from drug overdose.
- OD deaths decrease at an annual rate of 8.05% over the last 3 years.
- The OD death rate is 16.7 deaths out of every 100,000 residents.
- This is 19.32% lower than the national average OD death rate.
- 0.92% of nationwide OD deaths occur in Oklahoma.
Oregon
- 615 overdose deaths per year.
- 1.70% of all deaths are from drug overdose.
- OD deaths increased at an annual rate of 5.64% over the last 3 years.
- The OD death rate is 14 deaths out of every 100,000 residents.
- This is 32.37% lower than the national average OD death rate.
- 0.87% of nationwide OD deaths occur in Oregon.
Pennsylvania
- 4,377 overdose deaths per year.
- 3.25% of all deaths are from drug overdose.
- OD deaths decrease at an annual rate of 1.00% over the last 3 years.
- The OD death rate is 35.6 deaths out of every 100,000 residents.
- This is 71.98% higher than the national average OD death rate.
- 6.22% of nationwide OD deaths occur in Pennsylvania.
Rhode Island
- 307 overdose deaths per year.
- 3.04% of all deaths are from drug overdose.
- OD deaths decrease at an annual rate of 1.43% over the last 3 years.
- The OD death rate is 29.5 deaths out of every 100,000 residents.
- This is 42.51% higher than the national average OD death rate.
- 0.44% of nationwide OD deaths occur in Rhode Island.
South Carolina
- 1,127 overdose deaths per year.
- 2.23% of all deaths are from drug overdose.
- OD deaths increased at an annual rate of 7.98% over the last 3 years.
- The OD death rate is 22.7 deaths out of every 100,000 residents.
- This is 9.66% higher than the national average OD death rate.
- 1.60% of nationwide OD deaths occur in South Carolina.
South Dakota
- 86 overdose deaths per year.
- 1.08% of all deaths are from drug overdose.
- OD deaths increased at an annual rate of 11.53% over the last 3 years.
- The OD death rate is 10.5 deaths out of every 100,000 residents.
- This is 49.28% lower than the national average OD death rate.
- 0.12% of nationwide OD deaths occur in South Dakota.
Tennessee
- 2,089 overdose deaths per year.
- 2.94% of all deaths are from drug overdose.
- OD deaths increased at an annual rate of 8.49% over the last 3 years.
- The OD death rate is 31.2 deaths out of every 100,000 residents.
- This is 50.72% higher than the national average OD death rate.
- 2.97% of nationwide OD deaths occur in Tennessee.
Texas
- 3,136 overdose deaths per year.
- 1.55% of all deaths are from drug overdose.
- OD deaths increased at an annual rate of 2.28% over the last 3 years.
- The OD death rate is 10.8 deaths out of every 100,000 residents.
- This is 47.83% lower than the national average OD death rate.
- 4.46% of nationwide OD deaths occur in Texas.
Utah
- 571 overdose deaths per year.
- 3.11% of all deaths are from drug overdose.
- OD deaths decrease at an annual rate of 5.38% over the last 3 years.
- The OD death rate is 18.9 deaths out of every 100,000 residents.
- This is 8.70% lower than the national average OD death rate.
- 0.81% of nationwide OD deaths occur in Utah.
Vermont
- 133 overdose deaths per year.
- 2.21% of all deaths are from drug overdose.
- OD deaths increased at an annual rate of 2.89% over the last 3 years.
- The OD death rate is 23.8 deaths out of every 100,000 residents.
- This is 14.98% higher than the national average OD death rate.
- 0.19% of nationwide OD deaths occur in Vermont.
Virginia
- 1,547 overdose deaths per year.
- 2.23% of all deaths are from drug overdose.
- OD deaths increased at an annual rate of 3.24% over the last 3 years.
- The OD death rate is 18.3 deaths out of every 100,000 residents.
- This is 11.59% lower than the national average OD death rate.
- 2.20% of nationwide OD deaths occur in Virginia.
Washington
- 1,259 overdose deaths per year.
- 2.21% of all deaths are from drug overdose.
- OD deaths increased at an annual rate of 2.99% over the last 3 years.
- The OD death rate is 15.8 deaths out of every 100,000 residents.
- This is 23.67% lower than the national average OD death rate.
- 1.79% of nationwide OD deaths occur in Washington.
West Virginia
- 870 overdose deaths per year.
- 3.71% of all deaths are from drug overdose.
- OD deaths increased at an annual rate of 0.93% over the last 3 years.
- The OD death rate is 52.8 deaths out of every 100,000 residents.
- This is 155.07% higher than the national average OD death rate.
- 1.24% of nationwide OD deaths occur in West Virginia.
Wisconsin
- 1,201 overdose deaths per year.
- 2.24% of all deaths are from drug overdose.
- OD deaths increased at an annual rate of 3.42% over the last 3 years.
- The OD death rate is 21.1 deaths out of every 100,000 residents.
- This is 1.93% higher than the national average OD death rate.
- 1.71% of nationwide OD deaths occur in Wisconsin.
Wyoming
- 79 overdose deaths per year.
- 1.56% of all deaths are from drug overdose.
- OD deaths decrease at an annual rate of 4.24% over the last 3 years.
- The OD death rate is 14.1 deaths out of every 100,000 residents.
- This is 31.88% lower than the national average OD death rate.
- 0.11% of nationwide OD deaths occur in Wyoming.
Sources
- Centers for Disease Control & Prevention (CDC), Drug Overdose Mortality by State
- CDC, National Center for Health Statistics: Data Finder
- CDC, Opioid Overdose: Drug Overdose Deaths
- CDC, Data Brief 394
- National Institute on Drug Abuse (NIDA), Trends & Statistics: Overdose Death Rates
| State | OD Deaths | OD Death Rate* |
|---|---|---|
| Alabama | 768 | 1.41% |
| Alaska | 132 | 2.96% |
| Arizona | 1,907 | 3.22% |
| Arkansas | 388 | 1.20% |
| California | 6,198 | 2.31% |
| Colorado | 1,079 | 2.80% |
| Connecticut | 1,214 | 3.89% |
| Delaware | 435 | 4.61% |
| Florida | 5,268 | 2.56% |
| Georgia | 1,408 | 1.65% |
| Hawaii | 242 | 2.12% |
| Idaho | 265 | 1.86% |
| Illinois | 2,790 | 2.54% |
| Indiana | 1,699 | 2.59% |
| Iowa | 352 | 1.16% |
| Kansas | 403 | 1.46% |
| Kentucky | 1,380 | 2.83% |
| Louisiana | 1,267 | 2.75% |
| Maine | 371 | 2.52% |
| Maryland | 2,369 | 4.68% |
| Massachusetts | 2,210 | 3.74% |
| Michigan | 2,385 | 2.41% |
| Minnesota | 792 | 1.77% |
| Mississippi | 394 | 1.22% |
| Missouri | 1,583 | 2.51% |
| Montana | 143 | 1.43% |
| Nebraska | 161 | 0.95% |
| Nevada | 647 | 2.62% |
| New Hampshire | 407 | 3.19% |
| New Jersey | 2,805 | 3.70% |
| New Mexico | 599 | 3.15% |
| New York | 3,617 | 2.30% |
| North Carolina | 2,266 | 2.41% |
| North Dakota | 82 | 1.27% |
| Ohio | 4,251 | 3.42% |
| Oklahoma | 645 | 1.58% |
| Oregon | 615 | 1.70% |
| Pennsylvania | 4,377 | 3.25% |
| Rhode Island | 307 | 3.04% |
| South Carolina | 1,127 | 2.23% |
| South Dakota | 86 | 1.08% |
| Tennessee | 2,089 | 2.94% |
| Texas | 3,136 | 1.55% |
| Utah | 571 | 3.11% |
| Vermont | 133 | 2.21% |
| Virginia | 1,547 | 2.23% |
| Washington | 1,259 | 2.21% |
| West Virginia | 870 | 3.71% |
| Wisconsin | 1,201 | 2.24% |
| Wyoming | 79 | 1.56% |
